Quick Links
YouTube Channel
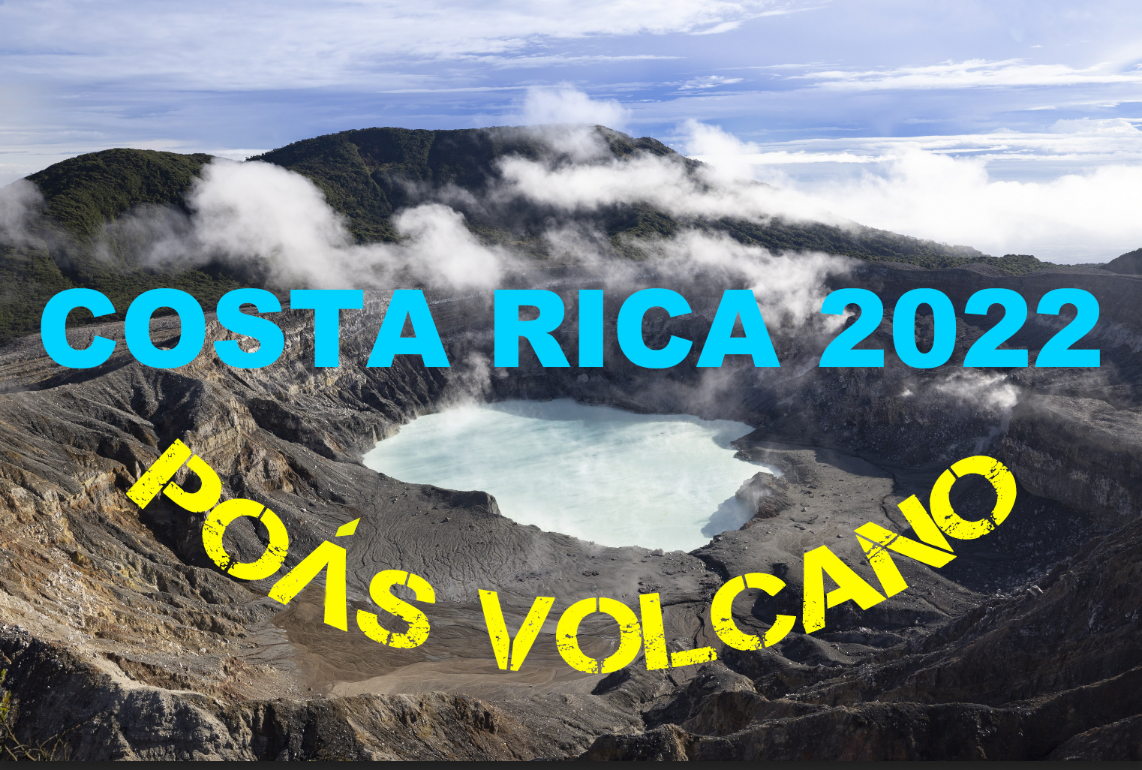
Poás Volcano, Costa Rica - thermal imaging, LiDAR and photogrammetry from drones!
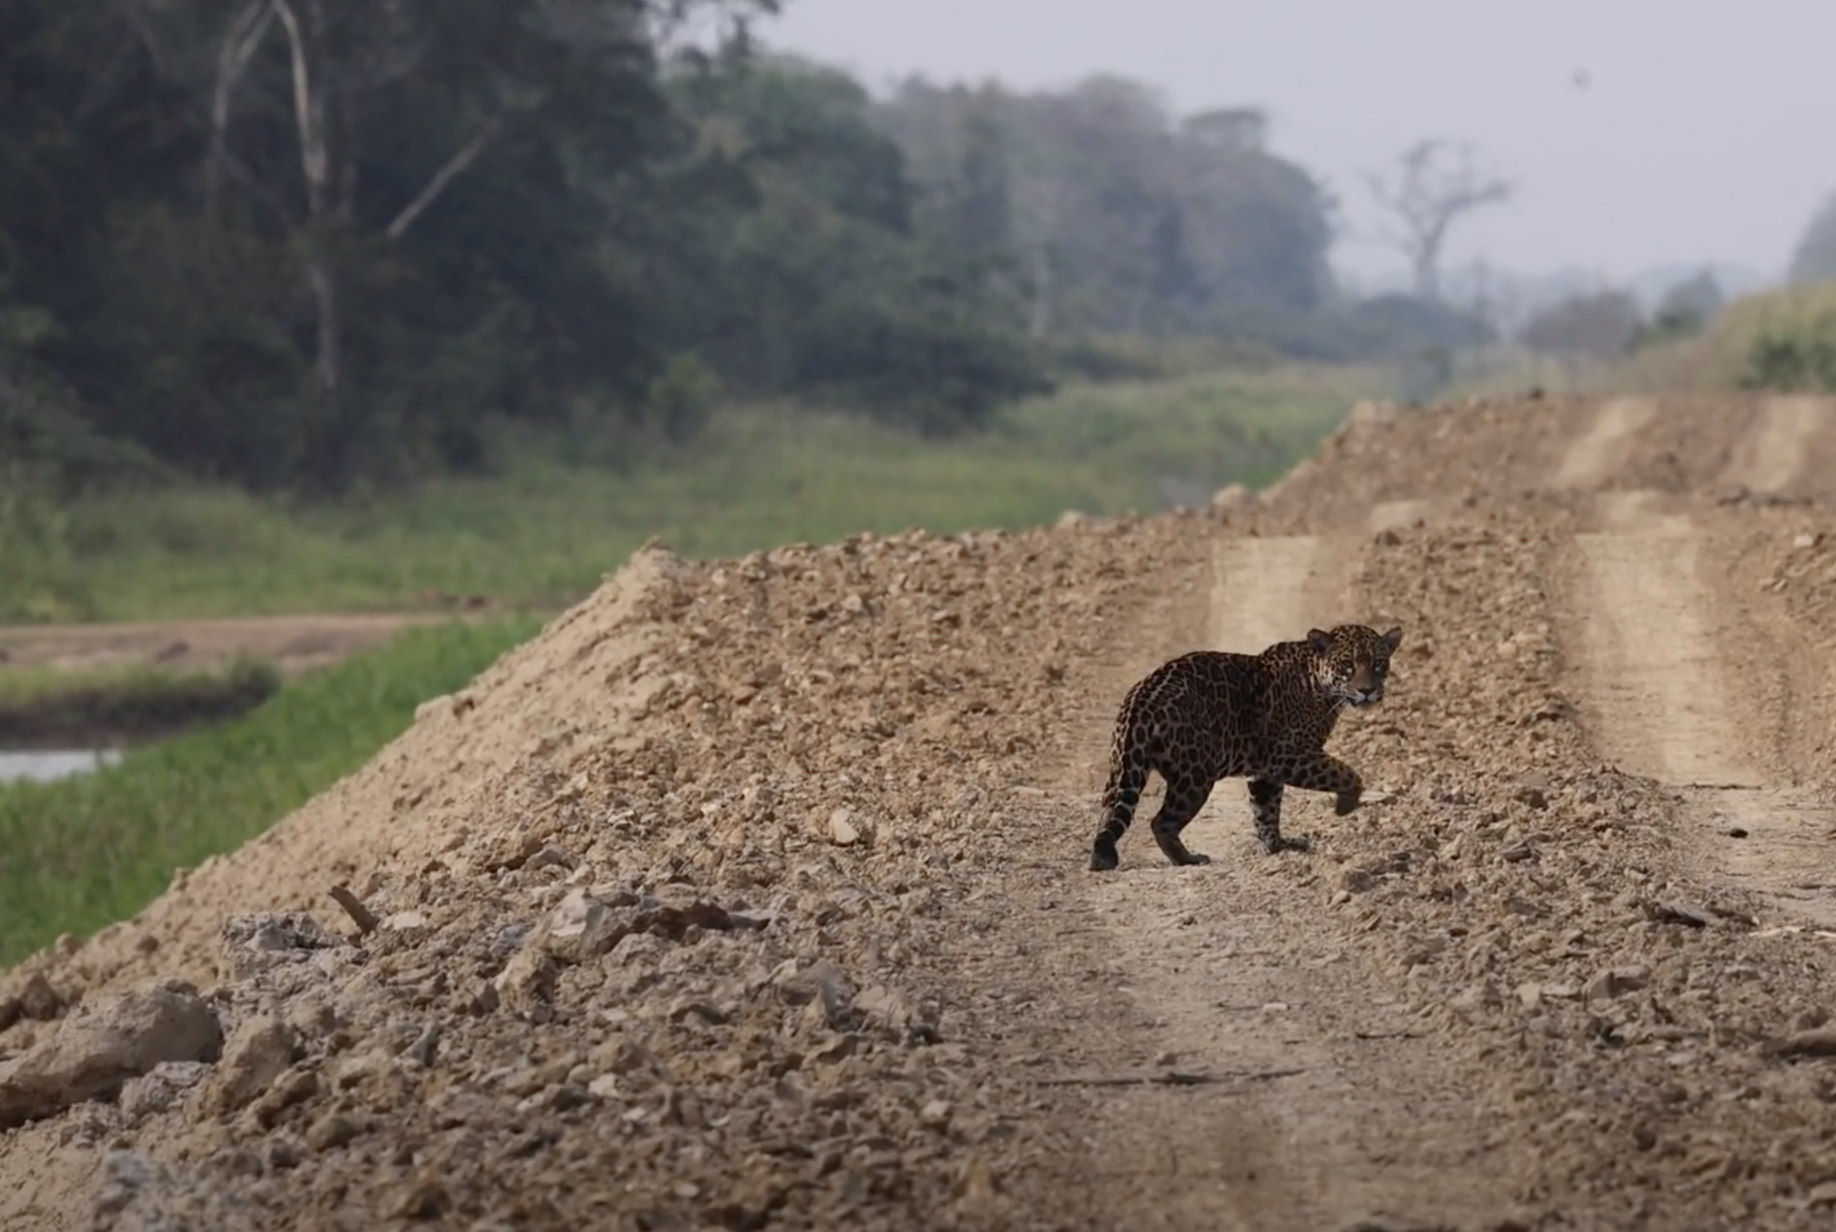
Laser scanning wildlife tracks in Bolivia: Jaguar, Capybara and more
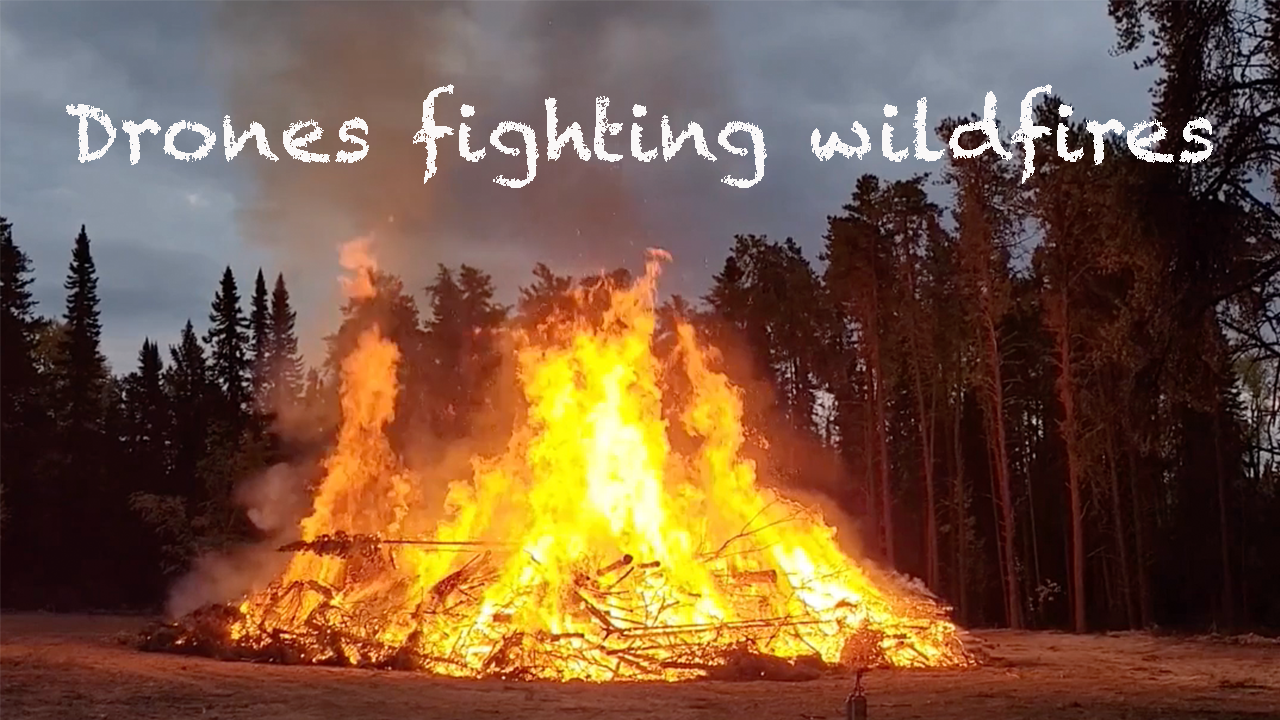
Drones fighting wildfires
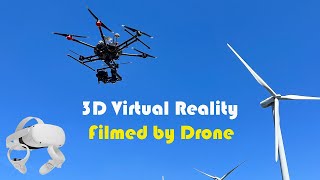
3D Virtual Reality filmed by drone
Recent Presentations
The Advantages of a Point Cloud Data Representation in the Distribution, Analysis and Application of Hyperspectral Imaging Data
Determining the Spectral Separability of Submerged Aquatic Vegetation of the St. Lawrence River
Quantifying Spectral Complexity Metrics Using Hyperspectral Imagery for Forest Ecosystem Assessment
Characterizeing and Mitigating Sensor Generated Spatial Correlations in Airborne Hyperspectral Imaging Data
Remote Sensing of Invasive Phragmites within Îles-de-Boucherville National Park
Data Hosting, Distribution and Metadata of CABO Hyperspectral Imagery
Exploring the application constraints of optical remote sensing to the study of inland submerged aquatic vegetation
CABO Hyperspectral Imagery Processing Workshop
Videos from the field
360° video from one of the upper tributaries of the Xingu river, Brazil
See one of the upper tributaries of the Xingu River in virtual reality 360° . Filmed during the 2017 Fish+Forest Expedition to Brazil. Look closely at the water and you might even see a stingray! Video by M. Kalacska
This video is best viewed with a headset such as the Oculus Quest 2, HTC Vive Pro, or other virtual reality headset. If viewing this video on a computer monitor use the mouse to change the 360° view.
Aerial video of the Rio Iriri rapids, at the confluence of the Xingu
Filmed by UAV in 2016 by the Fish+Forest project- see the Rio Iriri, just upstream of the confluence with the Rio Xingu in Brazil. Tonino, our boat pilot is catching a very large cachorro, Hydrolycus armatus by hook and line! Check out our 3D models of a Hydrolycus skull and the Iriri rapids. Video by O. Lucanus
Rare aerial view from 2016 of Arapuja island before flooding by the Belo Monte dam
UAV video from Brazil by the Fish+Forest project filmed in 2016 showing the forest clearing on the Arapuja island in the Xingu river across from the city of Altamira. Video by O. Lucanus
Underwater virtual reality 360°
Underwater 360° video from one of the Xingu river's tributaries. The headwaters of the Rio Xingu in Brazil's Mato Grosso state drain small valleys in a region devastated by industrial agriculture from soy bean production and cattle farming. Where forest remains the rivers have clear water and many fish school in deep water. In this location an old bridge has collapsed, leaving behind timbers and structures in deep water (10 m/30 ft) below the new bridge. Video by O. Lucanus
This video is best viewed with a headset such as the Oculus Quest 2, HTC Vive Pro, or other virtual reality headset. If viewing this video on a computer monitor use the mouse to change the 360° view.
Lake Natron cichlids feeding in nature
Endangered Alcolapia latilabris, Alcolapia ndalalani and Alcolapia alcalica from the very shallow freshwater springs around Lake Natron, Tanzania. The natural range of these fish is very limited and they are highly vulnerable to changes in their environment. Read about their habitat in our publication in Remote Sensing Video by M. Kalacska
Cowichan Garry Oak Preserve, British Columbia
Video showcasing the endangered Cowichan Garry Oak Preserve on Vancouver Island, British Columbia, Canada. Filmed in 2019 during the Canadian Airborne Biodiversity Observatory (CABO) hyperspectral imaging campaign. Video by O. Lucanus.
Early morning flight over the Mer Bleue beaver pond
Early morning test fight with with a DJI Inspire 1, filmed in 2017 at the Mer Blue peatland, Ontario, Canada. Video by O. Lucanus
Aerial video from Olho d'Agua, Mato Grosso do Sul, Brazil
Crystal clear waters filled with aquatic vegetation. Many large fish such as the golden dorado (Salminus brasiliensis), Piraputango (Brycon hilarii) and Curimbata (Prochilodus lineatus) can be seen. Filmed in 2019 by the Fish + Forest Project. Video by O. Lucanus
Sunrise at the Mer Bleue peatland
UAV video at sunrise over the Mer Bleue peatland, near Ottawa, ON, Canada. Video by O. Lucanus
Close up view of Garry Oaks
UAV video of Garry Oak trees at the Cowichan Garry Oak Preserve, British Columbia, Canada. Filmed for the Canadian Airborne Biodiversity Observatory (CABO). Video by O. Lucanus
Fly through from Ile Grosbois, Montreal, QC
UAV fly through of one CABO's focal study sites on Ile Gros Bois in Parc national des Îles-de-Boucherville. Video by O. Lucanus
First FPV video from the Mer Bleue peatland
Experience a fly through of the Mer Bleue peatland in first person view (FPV) mode. Video by O. Lucanus
Recording of an early morning aerial live-stream from Mer Bleue
Check out the Mer Bleue peatland at 5 in the morning. A unique aerial perspective of the peatland not many have seen in person. Video by O. Lucanus
Animated Models
Fly through of the Cowichan Garry Oak meadow reconstructed in 3D
Structure from Motion photogrammetry reconstruction of part of the Cowichan Garry Oak Preserve meadow, British Columbia, Canada. Photographs acquired in 2018 for CABO with a DJI Inspire 2.
3D SfM model from the Cowichan Garry Oak Preserve
Structure from Motion photogrammetry reconstruction of part of the encroachment upon the Cowichan Garry Oak Preserve, British Columbia, Canada. Photographs acquired in 2018 for CABO with a DJI Inspire 2.
Tutorials
How to view SfM or LiDAR point clouds in Augmented Reality via Sketchfab app
3D point clouds, or mesh models hosted on Sketchfab can be viewed in Augmented Reality on a smartphone (iOS or Android) using the Sketchfab app. This video shows how to find the ARSL models in the library.
How to interact with SfM or LiDAR point clouds in VR
Steps to launch VRifier via the Oculus Rift link on the Oculus Quest 2 headset. Once SfM or LiDAR point clouds have been converted to .ply format they can be viewed and interacted with in virtual reality.
ASDToolkit
Demonstration on the use of the ASDToolkit to process field spectral from an ASD spectroradiometer to generate Estimated Absolute Reflectance. See Elmer et al. 2020 for details.
Videos from Publications
Cowichan Garry Oak Preserve
Supplemental figure 1: Video acquired May 16, 2019 illustrating the vegetation at the Cowichan Garry Oak Preserve.
From Arroyo-Mora J.P., Kalacska M., Løke T., Schläpfer D., Lucanus O., Leblanc G. 2021. Assessing the impact of illumination on UAV pushbroom hyperspectral imagery collected under various cloud cover conditions. Remote Sensing of Environment 258(1):112396
3D SfM model from the Cowichan Garry Oak Preserve
Supplemental figure 2: Fly-through animation of the CGOP meadow dense 3D point cloud which was used to generate the DSM through IDW interpolation. The location of the reference panels is shown as well as the extent of the UAV-HSI imagery.
From Arroyo-Mora J.P., Kalacska M., Løke T., Schläpfer D., Lucanus O., Leblanc G. 2021. Assessing the impact of illumination on UAV pushbroom hyperspectral imagery collected under various cloud cover conditions. Remote Sensing of Environment 258(1):112396
3D environment surrounding the reference panels for UAV-HSI
Supplemental figure 3: 360 degree animation of the 3D environment extracted from the dense point cloud surrounding the location of the reference panels for May 16th and 17th, 2019.
From Arroyo-Mora J.P., Kalacska M., Løke T., Schläpfer D., Lucanus O., Leblanc G. 2021. Assessing the impact of illumination on UAV pushbroom hyperspectral imagery collected under various cloud cover conditions. Remote Sensing of Environment 258(1):112396
Fisheye photographs of sky conditions during UAV HSI acquisition at CGOP in 2019
Supplemental figure 4: Animation of fisheye photographs of the sky acquired May 15th and 16th 2019.
From Arroyo-Mora J.P., Kalacska M., Løke T., Schläpfer D., Lucanus O., Leblanc G. 2021. Assessing the impact of illumination on UAV pushbroom hyperspectral imagery collected under various cloud cover conditions. Remote Sensing of Environment 258(1):112396
Directly georeference hyperspectral point cloud (DHPC) animation from Mer Bleue
Supplemental video: DHPC in a 12 × 12 m region (R = 639.6 nm, G = 550.3 nm, B = 459.0 nm, linearly stretched from a reflectance value of 0–12% for display purposes)
From Inamdar D., Kalacska M., Leblanc G., Arroyo-Mora J.P. 2021 Implementation of the directly-georeferenced hyperspectral point cloud. MethodsX 8:101429
Hyperspectral point cloud from UAV data - Mer Bleue peatland
Supplemental video 1: Animation of the DHPC generated from UAV imagery from the Mer Bleue peatland
From Inamdar D, Kalacska M, Arroyo-Mora J.P., Leblanc G. 2021. The Directly-Georeferenced Hyperspectral Point Cloud: Preserving the Integrity of Hyperspectral Imaging Data Frontiers in Remote Sensing 2:675323
Hyperspectral point cloud from airborne data - Mer Bleue peatland
Supplemental video 2: Animation of the DHPC generated from airborne imagery from the Mer Bleue peatland
From Inamdar D, Kalacska M, Arroyo-Mora J.P., Leblanc G. 2021. The Directly-Georeferenced Hyperspectral Point Cloud: Preserving the Integrity of Hyperspectral Imaging Data Frontiers in Remote Sensing 2:675323
Hyperspectral point cloud from UAV data - Cowichan Garry Oak Preserve
Supplemental video 3: Animation of the DHPC generated from UAV imagery from the Cowichan Garry Oak Preserve
From Inamdar D, Kalacska M, Arroyo-Mora J.P., Leblanc G. 2021. The Directly-Georeferenced Hyperspectral Point Cloud: Preserving the Integrity of Hyperspectral Imaging Data Frontiers in Remote Sensing 2:675323
Supplemental video 4: Hyperspectral point cloud from airborne data - Mont Mégantic
Supplemental video 4: Animation of the DHPC generated from airborne imagery from Mont Mégantic
From Inamdar D, Kalacska M, Arroyo-Mora J.P., Leblanc G. 2021. The Directly-Georeferenced Hyperspectral Point Cloud: Preserving the Integrity of Hyperspectral Imaging Data Frontiers in Remote Sensing 2:675323
Timeseries of landcover change - Sinop, Mato Grosso, Brazil
Video figure 16a: Screen recording illustrating the land cover change animation from the Sinop hydropower plant lentic zone from 1984–2020 from Google Earth Timelapse.
From: Lucanus, O.; Kalacska, M.; Arroyo-Mora, J.P.; Sousa, L.; Carvalho, L.N. Before and After: A Multiscale Remote Sensing Assessment of the Sinop Dam, Mato Grosso, Brazil. Earth 2021, 2, 303-330.
Lentic zone of the Sinop hydropower dam reservoir from Google Earth VR
Video figure 16b: Screen recording of the lentic zone of the Sinop hydropower reservoir from Google Earth VR as seen through the Oculus Quest 2.
From: Lucanus, O.; Kalacska, M.; Arroyo-Mora, J.P.; Sousa, L.; Carvalho, L.N. Before and After: A Multiscale Remote Sensing Assessment of the Sinop Dam, Mato Grosso, Brazil. Earth 2021, 2, 303-330.
Ilha do Lair point cloud viewed in VR with the Oculus Quest 2
Video figure 17: Video of the Ilha do Lair (Mato Grosso, Brazil) dataset being viewed in VR with the Oculus Quest 2 HMD in VRifier.
From: Lucanus, O.; Kalacska, M.; Arroyo-Mora, J.P.; Sousa, L.; Carvalho, L.N. Before and After: A Multiscale Remote Sensing Assessment of the Sinop Dam, Mato Grosso, Brazil. Earth 2021, 2, 303-330.
Navigating the SfM and LiDAR point clouds on the Oculus Quest 2
Video figure 11: Video from VRifier illustrating the experience navigating the SfM and LiDAR point clouds on the Oculus Quest 2 headset.
From: Kalacska, M.; Arroyo-Mora, J.P.; Lucanus, O. Comparing UAS LiDAR and Structure-from-Motion Photogrammetry for Peatland Mapping and Virtual Reality (VR) Visualization. Drones 2021, 5, 36.
360° panorama of the Mer Bleue UAV SfM point cloud
Video figure 12a: Video illustrating a 360° panorama of the Mer Bleue SfM point cloud within VRifier. This panorama is being viewed on the Insta360 Player but can be opened by most 360° photograph viewers.
From: Kalacska, M.; Arroyo-Mora, J.P.; Lucanus, O. Comparing UAS LiDAR and Structure-from-Motion Photogrammetry for Peatland Mapping and Virtual Reality (VR) Visualization. Drones 2021, 5, 36.
360° panorama of the Mer Bleue UAV LiDAR point cloud
Video figure 12b: Video illustrating a 360° panorama of the Mer Bleue LiDAR point cloud within VRifier. This panorama is being viewed on the Insta360 Player but can be opened by most 360° photograph viewers.
From: Kalacska, M.; Arroyo-Mora, J.P.; Lucanus, O. Comparing UAS LiDAR and Structure-from-Motion Photogrammetry for Peatland Mapping and Virtual Reality (VR) Visualization. Drones 2021, 5, 36.
Augmented reality visualization of the Mer Bleue SfM point cloud
Video figure 13a: Video illustrating a screen recording of the AR visualization of the Mre Bleue SfM point cloud through the iOS Sketchfab application. The model can be viewed in AR at https://skfb.ly/onuUs
From: Kalacska, M.; Arroyo-Mora, J.P.; Lucanus, O. Comparing UAS LiDAR and Structure-from-Motion Photogrammetry for Peatland Mapping and Virtual Reality (VR) Visualization. Drones 2021, 5, 36.
Augmented reality visualization of the Mer Bleue LiDAR point cloud
Video figure 13b: Video illustrating a screen recording of the AR visualization of the Mre Bleue LiDAR point cloud through the iOS Sketchfab application. The model can be viewed in AR at https://skfb.ly/onuU9
From: Kalacska, M.; Arroyo-Mora, J.P.; Lucanus, O. Comparing UAS LiDAR and Structure-from-Motion Photogrammetry for Peatland Mapping and Virtual Reality (VR) Visualization. Drones 2021, 5, 36.
Hypancistrus zebra habitat underwater (Xingu river, Brazil)
Video figure 1. Hypancistrus zebra (zebra pleco) filmed in its natural habitat in the Xingu river, Brazil.
From: Sousa L., Lucanus O., Arroyo-Mora J.P., Kalacska M. 2021. Conservation and trade of the endangered Hypancistrus zebra (Siluriformes, Loricariidae), one of the most trafficked Brazilian fish. Global Ecology and Conservation 27:e01570
Applied Remote Sensing Lab
Department of Geography
McGill University
805 Sherbrooke West
Burnside Hall 305
Montreal, QC H3A 0B9
Canada
Project
About Us
Newsletter
Coming soon!